Strong grain transportation demand has continued since last fall’s record corn harvest, with rail volumes running above average while barge shipments lag behind, according to the latest Grain Transportation Report released July 30.
National grain stocks stood 17% above average on June 1, with the difference between June 1 and March 1 stocks reaching a record 138.7 million metric tons. The high disappearance rate suggests continued strong transportation demand as farmers and grain companies prepare for the upcoming fall harvest.
Several Midwestern states showed particularly elevated stock levels. Oklahoma led with stocks 67% above average, followed by Kansas at 41%, North Dakota at 36% and Nebraska at 35% above their typical levels.
U.S. corn exports in the third quarter of marketing year 2025/26 ran 1% ahead of last year and 20% above average. As of July 23, total corn commitments reached almost 87.0 million metric tons, the largest on record and exceeding USDA projections by 2.5 million metric tons. Mexico and Japan accounted for 46% of unshipped commitments.
Soybean exports rose 30% above last year in the third quarter, driven by increased shipments to Egypt and Indonesia, plus off-season sales to China. However, year-to-date soybean commitments totaled just 41.6 million metric tons, 18% below the previous marketing year and the lowest since 2012/13.
Diesel prices fluctuated sharply during the second quarter, averaging $5.35 per gallon, up 12.3 cents from the first quarter and 17.9 cents from the same period last year. Prices fell throughout most of the second quarter before spiking again in mid-July. The week ending July 20 saw diesel rise 33.8 cents, the second-largest weekly increase since conflict began in the Middle East.
The recent price surge resulted from Russia’s ban on diesel exports, reduced Russian refinery capacity and heightened conflict in the Persian Gulf, which restricted oil shipments through the Strait of Hormuz and Bab el-Mandeb Strait.
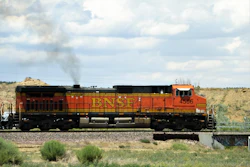
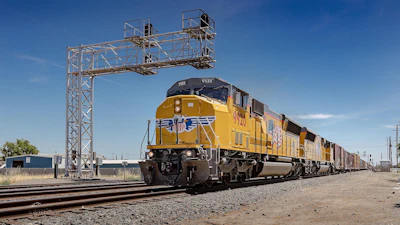
Rail transportation showed particular strength, with second-quarter grain carloads totaling 381,157 cars, up 26% from the quarterly average. Year-to-date grain carloads through July 18 reached 820,564 cars, up 24% from average and an all-time high for that period. January through June 2026 grain volumes hit their highest level since 1990.
Western Class I railroads drove the increase, with collective carloads up 30% from average. Eastern railroads saw volumes down 7% from average. July fuel surcharges averaged $0.61 per mile, a record high.
Barge movements told a different story. Second-quarter downbound grain shipments through Mississippi River System locks totaled 9.5 million tons, 10% above average but down 7% from 2025. Year-to-date barge movements ran 13% behind last year.
Ocean freight rates remained elevated. For the week ending July 23, rates from the U.S. Gulf to Japan reached $69.75 per metric ton, up 32% from last year. Vessel loading activity in the U.S. Gulf averaged 29 ships per week year-to-date, compared to 27 during the same period in 2025.
Looking ahead to marketing year 2026/27, USDA projects total production of corn, soybeans and wheat at 570 million metric tons, down 1% from the current year. Soybean production would reach a record 121.8 million metric tons, while wheat production would fall to the lowest level since 1970/71.