Soybean shipping costs increased significantly in the second quarter of 2026 for U.S. exports to China through both the Gulf and Pacific Northwest routes, driven by higher truck, rail, and ocean freight rates tied to increased diesel fuel prices and strong cargo demand. While costs to Europe through the Gulf declined, overall year-over-year comparisons showed transportation expenses rose for all U.S. and Brazilian soybean shipments to major markets.
- Truck rates rose across all U.S. routes due to declining availability and higher diesel fuel prices in Q2 2026
- Ocean freight to China increased because of strong cargo demand and elevated bunker fuel costs through the U.S. Gulf
- Transportation comprised 20-25% of U.S. landed costs to China and 12-18% to Europe in Q2 2026
- U.S. soybean exports to China reached 3.02 million metric tons in Q2 2026, up 395% year-over-year
- Upper Mississippi River reopening provided seasonal relief by eliminating rail portions of barge routes from Minneapolis and Davenport
From the first to second quarter of 2026, costs increased for exporting U.S. soybeans to China through both the U.S. Gulf and Pacific Northwest, while costs to Europe through the Gulf declined, the U.S. Department of Agriculture’s Agricultural Marketing Service reported in its Grain Transportation Report.
The competing pressures reflect the complex logistics facing the world’s two leading soybean producers as they vie for the same major overseas markets in China and Europe.
Transportation costs rise on multiple fronts
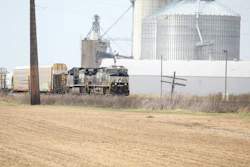
Truck rates rose for all U.S. routes as availability declined and diesel fuel prices increased during the second quarter. Rail rates also climbed for shipments to China through the Pacific Northwest, partly reflecting rising fuel surcharges tied to higher diesel prices.
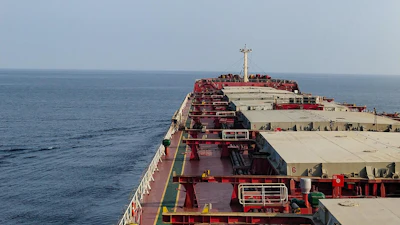
Ocean freight rates to China through the U.S. Gulf rose because of strong cargo demand and higher bunker fuel costs. However, ocean freight rates to Europe through the U.S. Gulf fell during the same period.
Some Midwest routes saw seasonal relief. With the reopening of the Upper Mississippi River in the second quarter, barge shipments from Minneapolis and Davenport, Iowa, no longer required rail for part of their route. By eliminating that rail portion, shippers lowered their costs. Barge rates from St. Louis and Havana, Illinois, also dipped following the river’s reopening.
Brazil’s costs to export soybeans to China and Germany rose with higher truck and ocean freight rates.
Year-over-year increases across the board
Comparing the second quarter of 2026 to the same period in 2025, transportation costs rose for all U.S. shipments to both China and Europe. For shipments to China, higher truck, barge, rail and ocean freight rates elevated total transportation costs. For shipments to Europe, higher truck and barge rates raised costs enough to offset falling ocean freight rates.
Brazilian shippers faced similar year-over-year increases, with higher truck and ocean freight rates driving up costs to both China and Europe.
Landed costs reflect farm value increases
Total landed costs, which combine transportation expenses with farm values, increased quarter-to-quarter for U.S. shipments to China through both the Gulf and Pacific Northwest. Landed costs to Europe through the Gulf also rose, though this increase reflected only higher farm values since transportation costs declined.
In the second quarter of 2026, transportation comprised 20-25% of U.S. landed costs for shipping to China and 12-18% for shipping to Europe. For Brazil, transportation made up 25-31% of total landed costs to China and 24-30% to Europe.
Export volumes shift dramatically
The United States exported 3.02 million metric tons of soybeans to China in the second quarter of 2026, down 61% from the first quarter but up 395% from the second quarter of 2025, according to USDA’s Foreign Agricultural Service data.
Brazil exported 32.29 million metric tons to China during the same period, up 101% from the first quarter and up 3% from the second quarter of 2025.
Looking ahead, USDA’s September World Agricultural Supply and Demand Estimates report projects total U.S. soybean exports at 45.86 million metric tons in marketing year 2026/27, up from 41.37 million metric tons in 2025/26. Brazil is projected to export 118.00 million metric tons in marketing year 2025/26, unchanged from the previous marketing year.
The transportation cost data comes from the USDA Agricultural Marketing Service’s weekly Grain Transportation Report, which tracks quarterly and yearly changes in the costs of moving soybeans from production regions to major export markets.