A new report from the USDA's Economic Research Service (ERS) says in recent decades, increased competition from countries such as Argentina and Brazil has threatened the current U.S. standing in market share for wheat and soybean exports.
U.S. Export Competitiveness in Select Crop Markets examines U.S. export competitiveness in terms of value of the top five crop commodity groups exported — corn, soybean products, cotton, wheat products and tree nuts. These commodities are widely produced in the U.S. and represented 38% of total U.S. agricultural exports in 2021.
The report broadly discusses the threats and opportunities to U.S. competitiveness, current trade agreements and world events that impacted global markets.
What did the study find?
Export shares and exports-to-production ratios indicate the U.S. continues to be the top exporter of corn, tree nuts and cotton, while other competitors have penetrated the global wheat and soybean markets.
Over the last decade, the U.S. lost its position in the global wheat market as the European Union (EU), Russia, and Ukraine gained market shares. Similarly, Brazil and Argentina continue to pose a challenge to U.S. soybean exports. For instance, since 2021, Brazil has been the largest exporter of soybean oilseed.
The U.S.'s involvement in trade agreements, particularly with emerging markets, contributes to its export competitiveness. However, from 2012 through 2020, the U.S. did not establish any new free trade agreements (FTAs), potentially limiting U.S. export opportunities in some emerging markets while other competitors signed multiple FTAs during that same period.
The results of the study highlight U.S. export competitiveness corn, soybeans and wheat:
- Corn: The U.S. remains the world leader in corn exports, though competition from Brazil, Argentina and Ukraine has increased in the last decade. U.S. corn exports were valued at over $9.2 billion in calendar year (CY) 2020 and $18.7 billion in CY 2021. U.S. corn represents a large share of the corn imported by China, Japan, South Korea, Mexico, and Colombia — all countries with a U.S. trade agreement in place.
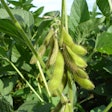
- Soybeans and derivative products: Soybeans continue to be the most valuable commodity exported by the U.S., valued at $25.5 billion in CY 2020 and $27.4 billion in CY 2021. Though U.S. soybean (including soybean meal and oil) trade has trended upward since 2000, it faces competition from Brazil and Argentina. China remains the largest market for U.S. soybean oilseed, which accounted for over $50 billion of U.S. soybean exports from 2016 to 2020. A potential threat to U.S. soybean exports is the heavy dependence on China for purchase.
- Wheat products: The U.S. is one of six major global wheat exporters — the others being the EU, Russia, Canada, Australia and Ukraine. Jointly these exporters accounted for over 70% of global wheat exports by value in CY 2021. The U.S. wheat market share, however, has trended downward since 2000. In CY 2021, U.S. exports of wheat products were valued at $7.7 billion. Major U.S. wheat export destinations shifted since 2000, with U.S. wheat exports to Egypt declining and wheat exports to Mexico and the Philippines increasing over the last decade. Drought and producer preference for higher value crops (e.g., corn and soybean oilseed) may reduce U.S. wheat production and exports.


