Dmitriev Mikhali Bigstock.com
The last USDA Grain Transportation Report of 2022 highlighted an eventful year for grain supply chain both in the U.S. and abroad.
Some challenges from 2021 persisted into 2022, and new ones emerged, such as historically low water levels, persistently poor rail service and record-high fuel prices.
Synopsis of agricultural transportation in 2022
- Year-to-year grain inspections fell. Total year-to-date (YTD) grain inspections for export fell below 2021’s near-record level.
As of December 22, YTD inspections were around 125.5 million metric tons (mmt)—a decrease from the same time last year, with corn and wheat falling 20% and 13%, respectively. Soybean inspections, however, increased 7%.
Corn and wheat inspected for export to Asia have fallen compared to last year. Soybeans inspected for export to Asia, Latin America and Europe have risen significantly from last year, with heightened demand in these regions. Second- and third-quarter 2022 soybean inspections increased tremendously, mainly reflecting higher shipments to Asia, Africa and Europe.
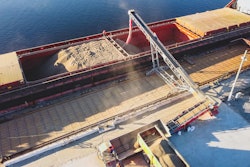
- Barge rates soared. Showing tremendous resilience, the barge industry faced many obstacles this year. Low water levels in the Mississippi River System (MSR) not seen since the 1980s led to barge-groundings; short supplies of barges; 17% to 28% reductions in draft size; and 24% to 30% drops in tonnage per barge.
For the first three quarters of the year, the southbound weekly grain tonnage through the MSR was slightly above the 3-year average. In the fourth quarter, low-water restrictions caused weekly southbound grain to fall significantly below the 3-year average.
During the week of October 11, in response to low water issues, barge spot freight rates reached an all-time high of $105.85/ton in St. Louis. On October 18, the water gauge at Memphis, Tennessee, reached an all-time low of -10.79 feet. Since then, barge spot freight rates have fallen over 50%, but still exceed the rates of last year and the 3-year average.
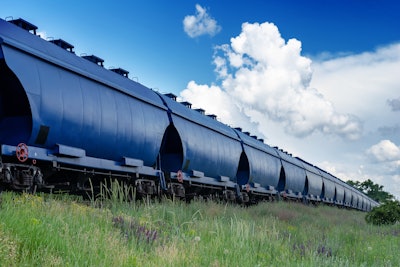
For the week ending December 24, YTD barged grain shipments were 32.3 million tons -- 11% lower than last year and 6% lower than the 3-year average. - Grain rail shippers faced poor service. Particularly problematic early in the year, rail service was at its worst in the second quarter, but still remains an issue for grain shippers.
At the end of June, the number of unfilled grain car orders (around 17,200) reached its highest level ever recorded. Despite showing improvements over the summer, some grain service metrics, such as the unfilled grain car orders, remain at problematic levels.
As of the week ending December 21, unfilled grain car orders (around 16,400) were again near their all-time high. In addition to costly delays, these service issues may have contributed to lower than usual grain rail volumes.
As of the week ending December 17, YTD grain carloads were 5% below 2021 YTD carloads and 4% below the prior 3-year YTD average.
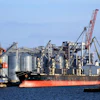
Rail service issues were also reflected in costs to shippers of obtaining car service. Bids for rail car service in 2022 were around $600/car more than average -- and substantially higher in some months. For example, bids for May service were around $1,100/car higher than average, while bids for October and November service were nearly $1,000/car higher than average. - Ocean freight rates fluctuated throughout the year. Many global and domestic factors spawned volatile ocean freight rates for shipping bulk commodities, including grain. Various contributing factors included weak cargo demand from a China strained by COVID-19, low vessel demand due to extreme weather in China and Europe, economic uncertainty from the Russian-Ukraine war, and rampant worldwide inflation.
As of December 15, the rate for shipping a metric ton of grain to Japan was $57 from the U.S. Gulf and $32 from the Pacific Northwest.
These rates were lower than the first available rates at the beginning of the year and the same period a year ago. YTD as of December 22, 1,431 grain vessels were loaded in the U.S. Gulf, versus 1,627 vessels in 2021. Through first quarter 2023, ocean freight rates are expected to stay moderate because of low trading activity occasioned by such holidays as global New Year celebrations and the Chinese Lunar year. - Fuel prices set record increases in 2022. From February to March, directly after Russia’s attack on Ukraine, the average U.S. diesel price rose $1.073, the largest month-to-month rise on record. From January to June, the average diesel price rose 55%, fell from July through September, rose in October and November, and then, fell for six straight weeks from November 14 through December 26. Despite this volatility, from January to November 2022, the average diesel price was 39% above the prior 3-year average.
According to the U.S. Energy Information Administration’s December Short Term Energy Outlook, the 2023 retail diesel price is expected to average $4.48/gallon, 13% below the expected full-year 2022 average of $5.05/gallon. The estimated drop is due to high refinery utilization and lower distillate refinery margins. Despite falling an estimated 19/ from 2022 to 2023, distillate refinery margins are still expected to double 2021 levels.