From first quarter 2021 to first quarter 2022 (year to year), inspections of grain from all U.S. ports decreased 10%, to 36 million metric tons (MMT), according to USDA’s Federal Grain Inspection Service (FGIS).
The year-to-year decrease in total grain inspections reflected lower inspections of all three commodities — corn, soybean and wheat.
Also, total inspections decreased from year to year for all major export regions, except the Interior.
First-quarter 2022 inspections marked a 12% decrease from the 5-year average.
Overall, grain inspections decreased mainly because of falling demand from Asia.
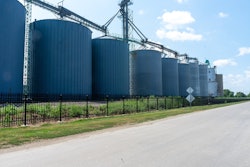
Breakdowns by region
U.S. Gulf: At 20 MMT, first-quarter 2022 grain inspections at U.S. Gulf ports were up 8% from the 5-year average and down 13% year to year.
Also, year to year, U.S. Gulf wheat inspections were up 23% because of less competition from Russian and Canadian wheat.
Total U.S. Gulf soybean inspections were down 26%, as a result of a drop in shipments to Latin America and Asia. U.S. Gulf corn inspections were down 7%.
The drop in grain inspections was also reflected in first-quarter rail deliveries of grain to U.S. Gulf ports, which decreased 28%.
Barge movements of grain to the U.S. Gulf through the locking sections of the Mississippi, Ohio and Arkansas Rivers were also down significantly.
Pacific Northwest. At 9 MMT, first-quarter grain inspections in Pacific Northwest (PNW) ports were unchanged from the 5-year average and down 16% year to year.
PNW corn inspections decreased 24%, and wheat inspections decreased 27% -- both drops reflecting lower demand from Asia and Latin America.
PNW first-quarter soybean inspections, however, were up 6%. Overall, lower PNW inspections were reflected in a 13% drop in first-quarter rail deliveries of grain to PNW ports.
Atlantic and Great Lakes. At 0.905 MMT, first-quarter grain inspections for Atlantic and Great Lakes ports were up 45% from the 5-year average and up 1% year to year.
These rises mainly reflected significantly higher corn inspections. Total grain inspections in the Atlantic and Great Lakes increased primarily to Caribbean and Latin American destinations.
Interior. At 4.9 MMT, first-quarter grain inspections in the Interior rose 33% from the 5-year average and rose 16% year to year.
At 3.8 MMT, Interior shipments of grain to Mexico were up 19%, and at 0.35 MMT, shipments to China were up 144%.
Inspections of corn rose 15%, soybeans rose 11%, and wheat rose 34%.
Market Outlook
According to the April release of USDA’s WASDE (World Agricultural Supply and Demand Estimates), the projected corn exports for marketing year (MY) 2021/22 did not change from the March WASDE numbers.
The forecast for wheat exports decreased, however, and the soybean exports forecast slightly increased.
From MY 2020/21, U.S. corn exports are projected to fall 9%; wheat exports are projected to decrease 21%; and soybean exports are projected to fall 6%.
Cumulative (shipped) marketing year-to-date export sales of corn and soybeans are 6% and 19% below the year-to-date sales for MY 2020/21, respectively.
Cumulative year-to-date export sales of wheat are 22% below MY 2020/21.