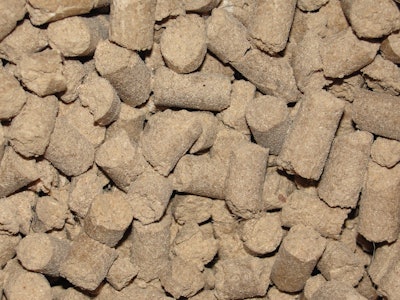
The sole objective of mixing is the uniform distribution of ingredients throughout the mixer and then delivering the uniform blend to the intended consumer. This blend could be as simple as two ingredients (whole oats blended with 1% molasses for horses) or as complex as 30-plus ingredients (cereals, plant proteins, animal proteins, vitamins, minerals, feed additives, enzymes, and multiple liquids for weanling pigs). This objective is affected by ingredient properties, equipment properties and management.
Ingredient properties which can influence mixer uniformity include:
- Particle size
- Particle shape
- Density
- Hygroscopicity (ability to absorbor attract water from air)
- Static charge
- Adhesiveness
Equipment properties which influence mixer uniformity include:
- Mixer design (e.g., twin shaft, paddle, ribbon)
- Maintenance
- Wear
- Cleanliness
Management influence on mixer uniformity include:
- Dialogue with nutritionists regarding formulation
- Ingredient sequencing (i.e., major scale introduced first into mixer)
- Over/under filling
- Measuring and analyzing
Mixer performance evaluation
The purpose of mixing is to have a homogenous blend of ingredients and is described by Coefficient of Variation (CV) expressed in percentage: % CV = Standard Deviation / Mean X 100.
Typically, a mixer uniformity test will be conducted by collecting 10 samples from the mixer in pre-designated areas, and a “marker” is tested within each sample.
Once samples are analyzed, a mixer CV can be calculated. Proper labeling of samples will also allow for an assessment of the mixer operation internally. For example, if we determined Chloride (Cl) was to be tested to analyze mixer CV and 10 samples were collected, samples #1-9 were 0.52-0.59% Cl and sample #10 was 0.41% Cl, the resulting CV is 9.7%. In this situation, even though there was a CV< 10%, location #10 at the mixer should be inspected for equipment problems such as worn/broken parts or buildup on the main shaft, ribbons, paddles, etc. Next, confirm that major ingredients are going into the mixer first, with minor and microingredients entering the mixer second and third, respectively. Finally, micro ingredients should enter in the center of the mixer not at the ends or corners.
What is the optimal marker to use for mixer uniformity? Many different assays are used, but the fundamental criteria for selecting a marker is it comes from a single source. The analytical variability of the marker should also be considered (e.g., feed additives analytical variability can be 35%). Clark et al. (2007) (Table 1) evaluated the effects of marker selection and mix time on mix uniformity. The data suggests synthetic amino acids are a consistent marker while crude protein should not be used as a marker for mixer uniformity. An illustration to verify why crude protein is an inferior choice for a marker would be as follows: Assume a 2-ton mixer is filled with 1 ton of SBM (48%CP) and 1 ton of porcine meat meal (50% CP). If the mixer was not turned on but 10 samples were taken for mixer analysis (and we assume no sampling error and exact nutrient profiles), 2.15% CV is the highest the CV could be.
Licensed medicated feed manufacturing facilities have been required to be in compliance with the FDA’s Current Good Manufacturing Practice (CGMP) regulations for many years. Title 21 Code of Federal Regulations Part 225.58 (Laboratory Controls) details how often one must analyze mixing uniformity with regard to medicated feed additives. Part 225.30 (Equipment) states equipment is to perform as intended and Part 225.65 (Equipment Cleanout Procedures) requires proper cleanout after mixing. While all parts are required, it is subject to individual interpretation regarding satisfactory levels. In the feed industry it is widely recognized that the standard target of mixer uniformity is CV <10%. There has been a move of feed facilities to achieve a CV <5%.
Bulk density
When there is an audit of the mixing system, formulation is a factor which encompasses ingredient properties. When was the last time your mixer was visually inspected with a batch of feed in the mixer? Overfill of the mixer can be one of the most common oversights made in manufacturing feed. A typical integrator (swine or poultry) formula is corn-soybean meal-based.
As volatility moves in commodity markets, there is always pressure to incorporate other coproducts into diets for least-cost optimization. While dried distiller’s grains with solubles (DDGS) is a co-product of the ethanol industry, DDGS have become a significant ingredient in many operations. Wheat midds also play an important role in animal nutrition, but both co-products have a light bulk density.
Thomas et al. (2014) evaluated the effects of bulk density on mixing uniformity and found a high fiber diet (30% DDGS and 18% wheat midds) with a low bulk density (28.8 pounds/cubic foot) took fourfold length of mix time to achieve a mixer CV <10% in comparison to a corn-soybean mealbased diet at a high bulk density (36.2 pounds/cubic foot).
It should be realized when a mixer is specified or engineered for purchase from an equipment manufacturer, a mixer is engineered on its volumetric capacity based on material bulk density. Table 2 shows the effects of bulk density on mixer capacity using common mixer models (defined by volume). If the mixer’s initial design was for material at 35 pounds/cubic foot, a reduction in mixer capacity is realized when materials change, for example, to 30 pounds/cubic foot.
Increasing efficiency
Management is continuously pushed to manufacture more feed in less time. Feed mills may not have the opportunity to build a new plant to increase speed. They may not even have room or the structural integrity to install a larger mixer to increase capacity. As time passes, many subtle changes occur. Formulations change, employee operators change, software updates, etc. and this presents opportunities to review the
entire batch cycle.
Table 3 describes a theoretical batch cycle and the effects of reducing batch cycle time 15 seconds (5 seconds in three different areas). This theoretical operation shows the potential for increased efficiency with regard to weekly capacity using mixer fill, mixer discharge, and wet mix time to gain almost 600 tons/week.
Many operators will advise whether the dry mix time and the wet mix time (if any) is at a satisfactory level; however, has it been recently tested? There are several other components a facility can evaluate before and after mixing.
Understandably, this is an analogy and a facility may not find five seconds at one step, but maybe onetwo seconds at three to five locations. There may be restrictions with regard to storage capacity. There may be limits downstream with regard to pelleting. Wouldn’t it still be acceptable to have audited the mixing process to find 150 tons of capacity with a 5-ton mixer and do so not spending a dime?
Current issues
What is currently happening with mixers in the feed industry? Stuart Martin, agribusiness sales manager with Hayes & Stolz Ind. Mfg. Co., stated there are several tendencies happening.
"Bigger andfaster is always being asked for. We are seeing more batch systems of 14-ton capacity.” Martin continued, “Safety is always a top concern and there is a strong move to have ease of access to the equipment. With this we are adding more doors for both inspection and cleaning or repair. This reduces entry into the mixer requiring a confined space permit.”
Pete Calderón, general manager with Scott Equipment Co., had similar comments, stating, “Certainly with new builds, it is about maximizing throughput through the mixer which is usually via shorter mix times. The short mix times [less than two-minute cycle times] are most often accomplished in the twin shaft mixers, which is the majority of what we build today.
“The other big issue we see across plants of all sizes within the industry is the concern and effort to design features into the equipment to minimize/eliminate confined space entry. Toward this effort, side access doors in the mixers are becoming less of an option and more of a standard feature.”
Both Martin and Calderón stated there is a rapidly rising interest in food safety (i.e., mixer cleanout) with Food Safety Modernization Act implementation closing in on facilities. This has been the case in the petfood industry for several years but is making its way into the animal nutrition industry.
Conclusions
A uniform mixture is the objective of every feed manufacturer. With increased stress on feed facilities for throughput, regulatory compliance, animal performance and food safety, manufacturers need to be conscious of their mixing operations. Mixer performance can be a complex issue with each mixer analysis being unique due to diet formulation, particle size of raw ingredients, use and wear on the mixer, mixer cleanliness, individual sampling, mix time and all the other influencing factors. However, nothing can be improved upon if the initial step to measure and collect data is not done. ❚
Patrick Clark is a consultant supporting the food, feed, and grain industries in improving processing efficiencies and regulatory compliance. Clark has 15 years of experience in the private sector working with feed manufacturers, premix operations and OEMs, in addition to experience with the FDA, OSHA, and EPA. Clark is a certified FSMA Preventive Controls Qualified Individual lead instructor and an adjunct professor at Kansas State University’s Department of Grain Science, where he completed his B.S., M.S., and Ph.D.


