Each day across America, more than 6,200 animal food manufacturing facilities are quietly humming along, producing millions of tons of animal food to provide the right nutritional balance to keep the country’s livestock, poultry and pets happy and healthy. Today, the Institute for Feed Education and Research (IFEEDER) is proud to share the results of two, first-of-a-kind, yearlong research projects, which quantify the industry’s contribution to the national, state and local economies. It also provides a comprehensive analysis of the ingredients used in the top livestock, poultry and aquaculture diets.
“For the past few decades, the animal food industry has spoken about the value and service it provides to its customers in producing some of the safest, highest quality animal food on the planet,” said Paul Phillips, IFEEDER’s 2017-18 chairman of the Board of Trustees. “Now, we have the data to prove to our nation’s leaders that this industry is an integral part of the agricultural economy, providing hundreds of thousands of jobs and generating billions of dollars in taxes and revenue to support local and state communities.”
IFEEDER commissioned Decision Innovation Solutions (DIS), an economic research and analysis firm, in early 2017 to conduct a first-ever economic analysis of the U.S. animal feed and pet food manufacturing industry. The recently completed study found that in 2016, the U.S. animal food manufacturing industry contributed $297.1 billion in total U.S. sales, including roughly $102 billion in value-added contributions; over $22.5 billion in local, state and national taxes; and over 944,000 jobs.
According to the report, five states—Missouri, California, Texas, Pennsylvania and Iowa—topped all economic measures by contributing a combined roughly 337,000 jobs, $105.2 billion in total sales and $8.3 billion in local, state and national taxes. Several congressional districts (KS-2, IA-4, IA-2, KS-1 and NE-3) located in the Midwest or plains states, where a majority of livestock and poultry are raised, also rose to the top, providing a combined nearly 98,000 jobs, roughly $32.7 billion in total sales and $2.1 billion in taxes to the economy.
The DIS report listed a number of factors that play a role in the animal food industry’s ongoing economic output and said the odds are good the industry will adapt and grow stronger.
“We hope that this report will illuminate the significant contributions our industry is having on the economy,” said Joel G. Newman, IFEEDER’s president and the American Feed Industry Association’s (AFIA) president and CEO. “Our nation’s leaders need to move forward with achieving sensible state and federal regulations so that the animal food manufacturing business can continue to thrive, and with it, U.S. animal agriculture as a whole can thrive.”
The second part of the DIS research focused on quantifying the amount of food consumed by the top nine livestock, poultry and aquaculture species throughout the various stages of their lives. In years past, AFIA used data from the U.S. Department of Agriculture’s National Agricultural Statistics Service on the number of animals processed for food each year and, working backwards, estimated a general diet per animal species to get the total amount of food consumed by livestock and poultry. In 2017, DIS conducted a more comprehensive approach, in which it worked with roughly 25 industry and university subject matter experts to determine the specific diets fed to animals at various stages of their lives and adjusted them for regional dietary differences, due to the availability of ingredients and best management practices.
“The latest animal consumption report provides us with more precise and comprehensive data by species, region and in total about the types of ingredients used in animal diets, giving us a clearer picture about the massive amounts of food consumed by livestock, poultry and aquaculture across the industry,” Phillips said. “It is clear that the U.S. animal food manufacturing industry is at the critical intersection of plant and animal agriculture.”
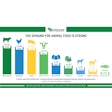
Overall, DIS found that in 2016, approximately 236.3 million tons of animal food were fed to nine animal species, including: 74.7 million tons to cattle on feed; 56.3 million tons to broilers; and 46.3 million tons to hogs, the top three animal consumers. Iowa, Texas, Nebraska, North Carolina and Minnesota topped the list for the sheer amount of animal food consumed with 21.1 million tons, 17.3 million tons, 15.4 million tons, 12.6 million tons, and 11.3 million tons, respectively.
Corn, the most abundantly produced crop in the United States, made up slightly more than half of the total amount of animal food consumed, but when combined with soybean meal and dried distiller’s grains with solubles (DDGs), represented more than 75 percent of all feed tonnage provided in 2016. DIS also reported on a number of other ingredients that are used in animal diets besides the top commodities. For instance, at least 1 percent of all tonnage fed to livestock and poultry in 2016 came from: wet distiller’s grains, bakery meal, corn gluten feed, cottonseed meal, wheat midds, grain sorghum, soybean hulls and oats.
“Through continuous improvements and the adoption of new technologies and best practices, our industry is making our animal food products revered as the ‘gold-standard’ around the world. I hope that our nation’s leaders will recognize this and move forward with responsible, science-based policies,” Newman added.
IFEEDER released both reports during the 2018 International Production and Processing Expo, being held this week in Atlanta, Georgia. The reports, along with interactive maps that allow users to search by their states and congressional districts, are available on AFIA’s website under “Economic Contribution” and “Animal Food Consumption.”

