A review of feed grain and ethanol exports in marketing year 2015/2016 — and continued into the first quarter of 2016/2017 — shows a positive demand picture. Analysis in terms of feed grains in all forms indicates will continue well into the future based on global demand growth trends.
Exports of commodity U.S. feed grains hit 86 million metric tons (3.39 billion bushels) in 2015/2016. This included 48.1 million metric tons (1.89 billion bushels) of corn, the top seller, 8.56 million metric tons (337 million bushels) of sorghum and 173,000 metric tons (7.98 million bushels) of barley.
Feed grains in all forms looks at these numbers as well as feed grains exported by the United States in value-added forms: distiller’s dried grains with solubles (DDGS), corn gluten feed (CGF), corn gluten meal (CGM), ethanol as measured in corn equivalents, meat and poultry as measured in corn equivalents, and processed feed grain products.
The goal of this calculation is to capture the amount of total grain demand from overseas buyers; in other words, how much of what U.S. farmers are producing is really being used to serve our global customers?
A new methodology
Unprocessed feed grains accounted for almost 16% of U.S. feed grain production in the 2015/2016 marketing year. Exports of unprocessed feed grains (corn, sorghum and barley), however, accounted for only 57% of total exports of feed grains in all forms.
When all feed grain exports are considered, using this calculation, exports consumed 27% ofU.S. grain including value-added forms of feed grain exports. All told, more than 100.5 million metric tons (3.96 billion bushels) of U.S. feed grains in all forms were exported in marketing year 2015/2016.
The 2015/2016 marketing year trade volume of U.S. feed grains in all forms ranks as the second largest in history. The largest export volume recorded by this measure was in 2007/2008 with 100.6 million metric tons.
This volume is comprised of significant trade volumes in each of the commodities. Those breakdowns are as follows:
Looking at the numbers: Corn
Exports of U.S. corn totaled more than 48.1 million metric tons of U.S. corn (1.89 billion bushels) in the 2015/2016 marketing year, an increase of 2%. The top recipients of U.S. corn included Mexico, Japan and Colombia.
Mexico became the top importer of U.S. corn, beating longtime partner Japan out of the top spot. Exports of U.S. corn to Mexico totaled 13.3 million metric tons (524.4 million bushels), an 18% increase from the 2014/2015 marketing year.
U.S. exports of corn to Colombia totaled more than 4.55 million metric tons (179 million bushels). The United States filled the 2.55-million-metric-ton tariffrate quota (TRQ) outlined in the Colombia-U.S. trade promotion agreement which was filled in March 2016. Yet, duties for corn in the Southern Common Market (MERCOSUR) were at a rate twice or three times higher than the out-of-duty for U.S. corn. This set U.S. corn for a clear advantage in the global market.
Showing the demand potential in Latin America given the right trade policy and trade servicing, four countries in the Dominican Republic-Central America Free Trade Agreement (CAFTA-DR) broke record exports of U.S. corn. CAFTA-DR allowed trade liberalization between the U.S. and its other participants through the creation of tariff rate quotas (TRQs) and elimination of tariffs, and the numbers show it worked.
In the 2014/2015 marketing year, more than 850,000 metric tons (33.5 million bushels) were exported to Guatemala. The new record of more than 880,000 metric tons (34.7 million bushels) is a 3.6% increase from last year.
El Salvador increased its imports of U.S. corn by 22% from last year. With more than 650,000 metric tons (26.1 million bushels) of U.S. corn exported to El Salvador, the previous record of more than 538,000 (21.2 million bushels), set in 2006/2007, was broken with an increased volume of 21%.
In the 2010/2011 marketing year, Honduras reached a record level of importing U.S. corn with more than 442,000 metric tons (17.4 million bushels). The new record set was of more than 549,000 metric tons (21.6 million bushels), a 24% increase.
Nicaragua has back-to-back records of importing U.S. corn. Last year, Nicaragua imported more than 191,000 metric tons (7.52 million bushels) of U.S. corn, with the volume then rising by 35% to more than 258,000 metric tons (10.2 million bushels) to set a new record.
Looking at the numbers: DDGS
U.S. DDGS exports experienced the second highest volume in history of 11.7 million metric tons, an increase of 1% from the previous marketing year.
China, Mexico and Vietnam were the three largest importers of U.S. DDGS, with record volumes being sent to Mexico and Vietnam. Exports steadily increased in several countries, with a healthy increase of 68% in the Middle East and North Africa region. In Turkey, exports doubled from 344,000 to 695,000 metric tons. Exports of DDGS increased by 96% to Israel, from 103,000 to 202,000 metric tons. Morocco imported 42% more U.S. DDGS, from 100,000 to 143,000 metric tons. U.S. DDGS exports to Tunisia increased from 4,700 to 14,000 metric tons.
Other notable increases from the previous marketing year occurred in Asian countries: South Korea increased purchases by 36%, from more than 620,000 metric tons to more than 844,000 metric tons; Thailand experienced an increase of 44% — from 406,000 metric tons to 587,000 metric tons; and Indonesia imports rose 46% from 230,000 metric tons to 335,000 metric tons.
Several Latin American countries had noteworthy gains in U.S. DDGS imports: Colombia imported 46% more, growing from more than 111,000 to 163,000 metric tons; El Salvador’s imports of U.S. DDGS rose to a record 66,000 metric tons from 49,000 metric tons; and Honduras also imported a record amount of U.S. DDGS — 43,000 metric tons — an increase of 12% from last year.
Looking at the numbers: Ethanol
A new area for grains-in-all-forms demand is exports of U.S. ethanol, which totaled more than 868.3 million gallons (9.85 million metric tons in corn equivalent) in the last marketing year. The United States’ top ethanol customers were Canada, China and Brazil.
Other markets also had nota-ble performance: Exports of U.S. ethanol grew exponentially to China, increasing 13-fold from 130,000 gallons to 1.73 million gallons (130,000 to 1.72 million metric tons in corn equivalent). U.S. exports to India increased 25% from 53.3 million gallons to 66.9 million gallons (484,000 to 607,000 million metric tons in corn equivalent). Ethanol exports to Peru increased by 90%, from 18.2 million gallons to 34.6 million gallons (165,000 to 314,000 million metric tons in corn equivalent).
A strong U.S. dollar and low ethanol prices have contributed to the high volume of U.S. ethanol being exported, coupled with U.S. Grains Council and ethanol industry programs to help spur countries to establish renewable fuel standards or increase mandates that will further grow ethanol demand.
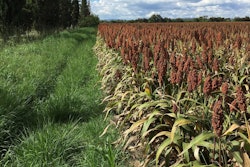
Looking at the numbers: Barley, Sorghum and Co-Products
U.S. sorghum exports have remained strong historically, but experienced a decrease of 4%. China ranked as the top customer for U.S. sorghum, importing more than 8.32 million metric tons. Mexico become the second largest importer of U.S. sorghum, with more than 606,000 metric tons (23.9 million bushels) imported in 2015/2016. Pakistan imported the third largest amount of U.S. sorghum in the marketing year with more than 204,000 metric tons (8 million bushels). South Africa imported more than 99,000 metric tons (3.9 million bushels) of U.S. sorghum, an almost 10-fold increase from the previous year. Other countries with large increases include a diverse set of markets, such as Indonesia, Somalia, Cameroon, Djibouti and South Korea.
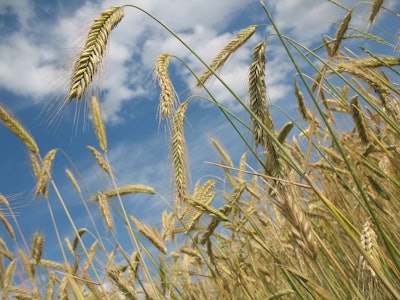
Mexico remained the top customer of U.S. barley with more than 140,000 metric tons (6.46million bushels) imported, a 42% increase from last year. The second and third largest customers of U.S. barley were Canada and Morocco, respectfully. Canada imported more than 51,000 metric tons (2.38 million bushels) while Morocco imported more than 13,000 metric tons (634,000 bushels) of U.S. sorghum. The United Kingdom imported more than 1,400 metric tons (64,000 bushels) of barley, a nearly four-fold increase. A growing craft brewery sector had led to increasing demand of barley across the globe.
Also contributing to the feed grains-in-all-forms total are corn gluten feed, corn gluten meal and coarse grain products. In the 2015/2016 marketing year, more than 1.09 million metric tons of CGF, 749,000 metric tons of CGF, and more than 1.45 million metric tons of value-added coarse grain products were exported across the globe.
Working to capture demand over time
According to 10-year projections by the USDA and USGC, feed grains in all forms have a positive outlook with exports expected to increase by 25.6 million metric tons (1.04 billion bushels) to 127 million metric tons (5 billion bushels) by 2025/2026. That would represent almost a third of U.S. production with international markets for U.S. corn as an animal feed, ethanol and meats as the industry’s principal drivers.
This growth is dependent on strong trade policy and market development making it possible for overseas customers to rely on both unprocessed and value-added U.S. feed grain products for their needs.
Addressing the challenges and opportunities in the global market is core to the mission of the Council, which is working actively to keep the current export surge going in 2016/2017 and expanding long-term demand for feed grains through its global outreach.