Brown, B. and C. Zulauf. "Recapping USDA’s March 1 Grain Stocks and 2021 Prospective Planting Reports." farmdoc daily (11):53, Department of Agricultural and Consumer Economics, University of Illinois at Urbana-Champaign, April 5, 2021.Permalink
Introduction
This article recaps the information provided by the United States Department of Agriculture (USDA) in the March 31, 2021 release of March 1 Grain Stocks and 2021 Prospective Plantings. The quarterly Grain Stocks report provides an opportunity to assess the pace of consumption during the first half of the corn and soybean marketing year, and the first three quarters of the marketing year for wheat as well as on-farm and off-farm stock positions by state. The latter sets the foundation for cash-futures basis ahead of 2021 US production. The point in time Prospective Plantings report provides an indication of what US producers anticipate plantings to be in 2021 as of the first two weeks of March. These intentions set the foundation for deferred futures contract prices. Actual plantings may differ from the March intensions depending on planting conditions, economic incentives, and producer sentiment. These factors will be captured in the June Acreage report.
Report Estimates vs Market Analyst Expectations
The March 1 Grain Stocks report confirmed expectations of tightening stocks of corn, soybeans and wheat in 2021 compared to 2020. Total US stocks were down for all three crops from March 1, 2020. USDA reported corn, soybean, and wheat stocks on hand as of March 1 of 7,706, 1,543, and 1,314 million bushels, respectively. All three stocks estimates were within the range expected by market analysts (see Table 1). Estimated corn stocks were 61 million bushels less than the average trade estimates, while soybeans and wheat were larger than the average trade estimate by 21 and 26 million bushels, respectively. Survey respondents are asked to not include grain currently in transit at an export terminal or on a river barge. Three of the ten largest weekly export inspections of corn since 1989 occurred in the weeks following March 1- 86.6 million bushels, March 11; 77.9 million bushels, March 18; and 77.9 million bushels, March 25. These inspections ranked 2, 4, and 5, respectively. It is likely some of these bushels had left surveyed elevators and were in transit on March 1. This point should be remembered for third quarter corn usage calculations. Additionally, USDA revised December 1, 2020 Grain Stocks, reducing them by 27.9 million bushels for corn and increasing them by 13.4 and 29.1 million bushels for soybeans and wheat, respectively. Quarterly Grain Stocks reports occasionally contain information surprising to market observers, but the March 1, 2021 Grain Stocks report fell within market expectations.
| Table 1. USDA March 1 Grain Stocks and Industry Expectations
(Million Bushels) | ||||||
| USDA March 1, 2021 | Average Trade Estimate (Reuters)1 | USDA minus Average Trade Estimate | Range of Trade Estimates | USDA March 1, 2020 | Change from Prior Year | |
| Corn | 7,706 | 7,767 | (61) | 7,573-7,980 | 7,952 | (185) |
| Soybeans | 1,564 | 1,543 | 21 | 1,440-1,825 | 2,255 | (715) |
| Wheat | 1,314 | 1,278 | 36 | 1,227-1,415 | 1,415 | (137) |
| 1 Reuters Industry Survey– Reuters website | ||||||
The 2021 Prospective Planting report did surprise the markets. Using survey results from 78,858 US producers, USDA estimated total principal crop acreage for 2021 would be 316.2 million acres, up from 310.1 and 303.1 million acres in 2020 and 2019, respectively (see Table 2). Corn acreage, estimated at 91.1 million acres, was below average market analyst expectations of 93.2 million acres. Soybean acreage, estimated at 87.6 million acres, also came in below analyst average expectations of 90 million acres. This is the first year that market analysts had over-estimated both crops in the same year. They had underestimated both crops in the same year only twice. Combined corn and soybean acres totaled 178.7 million acres, nearly 4.5 million acres less than market analysts expected, and 3.3 million acres less than USDA released during the annual Agricultural Outlook Forum in February. All wheat acres were pegged at 46.4 million acres, 1.4 million higher than the average trade estimate. Winter wheat made up the bulk of the acreage increase. Cotton was up a little over 0.5 million acres compared to the National Cotton Council of America annual Early Season Planting Intentions Survey released in February. Grain sorghum mostly matched market expectations at 6.9 million acres, up slightly more than 1 million acres from 2020 on high prices relative to corn. These acreage numbers will continue to be scrutinized by market traders in the weeks and months to come but will serve as the starting point for USDA’s May World Agricultural Supply and Demand Estimates (WASDE) when balance sheets for 2021/22 crops are first included.
Table 2. USDA Prospective Planting Report and Industry Expectations (Thousand Acres) | ||||||
| USDA March 31, 2021 | Average Trade Estimate (Reuters)1 | USDA minus Average Trade Estimate | Range of Trade Estimates | USDA February Outlook 2 | Change from Prior Year | |
| Corn | 91,144 | 93,208 | (2,064) | 92,000-94,500 | 92,000 | 325 |
| Soybeans | 87,600 | 89,996 | (2,396) | 86,100-91,600 | 90,000 | 4,372 |
| Wheat- All | 46,358 | 44,971 | 1,387 | 43,000-46,400 | 45,000 | 2,009 |
| Wheat- Winter | 33,078 | 31,811 | 1,267 | 30,400-32,200 | N/A | 2,663 |
| Wheat- Durum | 1,540 | 1,641 | (101) | 1,300-2,200 | N/A | (144) |
| Wheat- Other Spring | 11,740 | 11,644 | 96 | 10,900-12,860 | N/A | (510) |
| Cotton3 | 12,036 | 11,500 | 536 | N/A | 12,100 | (57) |
| Sorghum4 | 6,940 | 6,909 | 31 | 6,762-7,056 | 7,200 | 1,060 |
| 1 Reuters Industry Survey all but cotton and sorghum- Reuters website
2 USDA Agricultural Outlook Forum, February 18-19, 2021 – Commodity Outlooks 3 National Cotton Council of America Early Season Planting Intentions Survey 4 University estimates 15-20% higher than 2020 | ||||||
The information provided by USDA in the March Grain Stocks and Prospective Planting reports often reveals broader themes driving future prices in the grain and oilseed complexes. The remainder of this article covers five observations derived from the March 2021 reports.
Observation #1- Feed and residual use of corn remained strong in the second quarter
Feed and residual use of corn remained strong in the second quarter of the 2020/21 marketing year at an estimated 1,621 million bushels, 208 million bushels above the 10-year average (see Figure 1). Feed and residual use during the first half of the 2020/21 marketing year is estimated to be 4,346 million bushels. This use equals 77% of the total for feed and residual use estimated in USDA’s March WASDE report for the entire 2020/21 marketing year. Over the previous four marketing years, first half use has represented roughly 67% of annual feed and residual use. USDA lowered corn used for feed and residual use in the January WASDE after the December 1 stocks number showed smaller than expected stocks and 2020 US corn production. Wheat use in feeds increase when corn price increases relative to wheat prices. This substitution was a possibility in the 2nd quarter, but USDA’s March 1 stock numbers for corn and wheat do not provide overwhelming evidence to support this substitution. It is possible the estimate for 2020 corn production is still high. USDA will review 2020 production again in September after the release of the September 1 Grain Stocks report. Corn used for feed and residual was impressive in the first half of the 2020/21 marketing year.
Observation #2- On-Farm Stocks Remain Within Historical Margins
Elevators, millers, and processors use local Basis (Cash price minus Futures Price) to attract grain and oilseeds into the business when needed. All else equal, basis strengthens when end users work harder to pull in the grain remaining on farm. With strengthening basis levels through much of February and March across the Midwest, concern of available grain on farm began to build. Figure 2. illustrates the share of grains stocks as of March 1 on and off farm since 2015. Share of corn, soybean, and wheat stocks on farm as of March 1, 2021 were 52%, 38%, and 22%, respectively. While among the lowest levels since 2015, these on-farm shares are not significantly different from prior years. The shares of grain remaining on farm suggest farm bins are not completely empty. USDA does not ask producers to distinguish between grain sold for delivery at a later date and unpriced grain. Therefore, it is not possible to determine the share of available unpriced grain relative to previous years.
Figures 3 and 4 attempts to identify where local deficiencies in grain and oilseed availability may be located across the country. Each state’s share of on-farm corn and soybean stocks were compared against national stock shares during 2013-2018. States were then classified as having a comparatively strong, comparatively weak, or a comparably normal basis relative to all of the other states combined. Expressed differently, basis can be up across the country, but relative basis may be comparatively stronger in blue states and comparatively weaker in red states. This analysis assumes the share of grain stored on-farm that has been sold is not abnormally large or small as of March 1, 2021.
Observation #3- Total Principal Crop Acres
One of the largest surprises in USDA’s Prospective Planting report by market observers was the collective sum of intended plantings for all field crops in 2021 at 316.2 million acres. Between 2015 and 2018 US producers planted just under 319 million acres of all principal crops combined (see Figure 5). Persistent and frequent rainfall prevented planting in many Midwest states in 2019 and lingering flood effects and decreasing market prices due to the Coronavirus early in the 2020 planting window relative to crop insurance guarantees held acres out of production again last year. With the highest crop insurance guarantees for corn and soybeans since 2013, producer optimism from US export sales, uncertainty over the size and availability of the South American crop given later than normal planting, and funds available from multiple rounds of the Coronavirus Food Assistance Program; market analysts expected acreage estimates to total the same or sightly above the 2015-2018 average. The lower than expected total principal crop acres triggered limit up ($0.25 for corn and $0.70 for soybeans) moves in corn and soybean futures contracts directly following the report’s release.
USDA’s annual Prospective Planting report is the first step in the bid-ask process. US producers put forth their 2021 crop intentions and the markets respond. Producers then adjust their planting decisions based on the price reaction. The 2021 Prospective Planting and Acreage reports serve as two points in time, but the negotiation between producers and the market moves fluidly between March and June. It is common to see planted acres in the June Acreage report differ from what producers indicated they would plant in the March Prospected Planting report (see Figure 6). On average, corn and soybean planted acres increased by 437 and 1,025 thousand, respectively, from March to June over the years 2014-2018. Soybeans have historically seen the largest increases in planted acres. If planting conditions allow, it is expected acreage will increase by a combined 1.5 million acres in the June Acreage report. The years 2019 and 220 are not used in this analysis because record large changes in intended acres occurred during these years in conjunction with historically large prevented plant insurance claims.
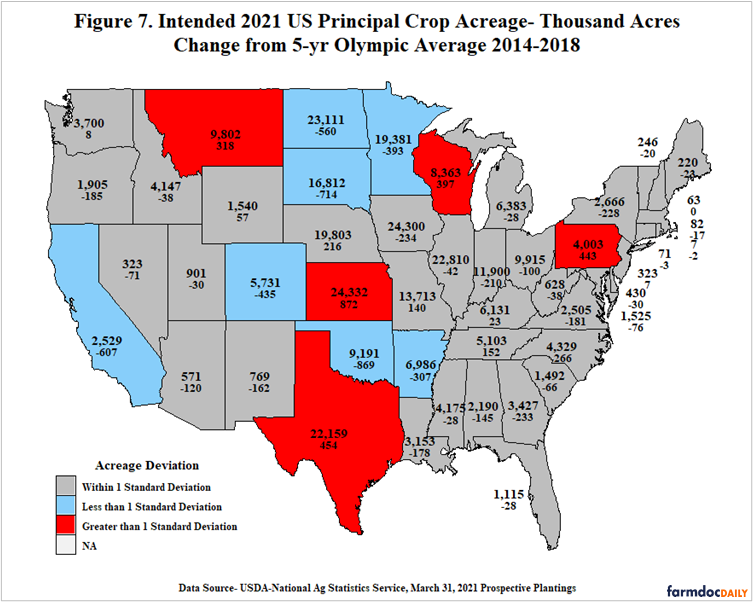
Figure 7 illustrates states where principal crop acreage reported in the 2021 Prospective Planting report differed by more than one standard deviation from a 5-year Olympic average of acreage between 2014-2018. States in the Upper Plains, including Minnesota, North Dakota, and South Dakota, all have the best chance of increasing principal crop acreage given the relationship to 2014-2018 planted acreage. At 24.3 million acres, Kansas had a strong increase in 2021 principal crop acres on higher grain sorghum acreage and winter wheat seedings. Montana, Pennsylvania, Texas, and Wisconsin all saw acreage increases in 2021 compared to the historical period. Input prices for fuel and fertilizer have increased over the last five months and could be a hindrance to additional acres. Weather during May and June has a large impact on final acreage of all crops but understanding where acreage may increase is important to local cash price as well as average US cash price if collectively large enough.
Observation #4- Winter Wheat Acreage Increased 3% from January Seedings Report
All wheat acres were 1.4 million above market analysist expectations in the Prospective Planting report. Mentioned previously, this gain was largely in winter wheat seedings that were up nearly 1.1 million acres from the January Winter Wheat and Canola Seeding report. Intended canola acres for Kansas and Oklahoma in the Prospective Plantings report were unchanged from the January report indicating additional factors besides fall planting conditions incentivized the increase in winter wheat acres. The additional 1.1 million acres was the largest change in acres between the two reports in the last decade (Figure. 8). However, it is not a record. There was a decrease in winter wheat acres compared to the seedings report of 1.1 million acres in 2005 and an increase of 1.2 million acres in 2009. Shifts in acreage were smaller between 2011 and 2020, before the increase this year. Additional winter wheat acres in Midwest states increase the chance of increased double crop soybean acres this summer.
Observation #5- New Crop Bids Adjust to Tighter 2021/21 Ending Stock Expectations
Multiple factors will dictate the size of 2021 corn and soybean crops in 2021. A derecho and a late season drought in the Midwest reduced the size of the 2020 crop after lofty expectations associated with planting progress and near perfect growing season weather through June. Fewer acres all else equal should result in smaller crops. The balance sheets for corn and soybeans continued to grow tighter throughout the winter on relatively strong demand and reduced supply. Lower than expected acreage in the Prospective Planting report had an impact on futures markets, and as expected a larger impact on deferred futures contracts. Figures 9 and 10 illustrate the market carry between contract months for corn and soybeans, respectively. Market carry refers to the difference in price between two delivery months. The market uses market carry to signal when it needs grain from producers. A positive carry in the market tells the producer grain is likely to be in greater demand in the future, whereas a negative market carry tells the producer grain is in greater demand today than it is expected to be in the future. Futures contracts for corn and soybeans at the close of trading on March 30, 2021 had a negative carry all the way into the next marketing year indicating the need for grain now was greater than the expected need for grain in the future. After the reports showed smaller expected acreage for corn and soybeans all futures contracts increased, but it was the deferred contract months that unsurprisingly increased the most. Market carry can be a powerful tool to gauge the markets expectations for availability of grain and oilseeds in the future.
Conclusion
Compared to pre-report expectations, March 1 grain stock for corn, soybeans, and wheat fell within the range of expectations. A downward revision for December 1 corn stocks continues to provide concern regarding the size of the 2020 US corn crop. Corn used for feed and residual use remained strong in the second quarter of the 2020/21 marketing year. Implied first half feed and residual use as a share of expected use for the marketing year is historically strong at 77%. The share of March 1 on-farm stocks is not statistically different from previous years.
The 2021 Prospective Planting report shocked grain and oilseed markets as total principal crop acres of 316.1 million acres remained below the 2014 to 2018 average of 317.8 million acres. Market analysts overestimated corn and soybean acres in the same year for the first time, causing futures prices to increase the entire one-day limit directly following the report’s release. Historical analysis of acreage changes between the June Acreage and March Prospective Planting reports suggests with continued favorable prices for corn and soybeans an additional 1.5 million acres may be possible in 2021. States in the Upper Plains are the most likely to see additional acres of principal crops. Prices for fall delivery appear appropriate given the pace of consumption through the first half of the 2020/21 corn and soybean marketing year and intended 2021 acreage. Market attention turns now to spring weather and planting progress in the US and Europe as well as growing weather for the safrinha corn crop in Brazil.
References
DTN, ProphetX. Historical Futures and Basis Prices. Accessed April 2, 2021.
National Cotton Council of America. Early Season Planting Intentions Survey. February 11, 2021. https://www.cotton.org/news/meetings/2021annual/pint.cfm
United States Department of Agriculture, National Agricultural Statistics Service. Grain Stocks. January 12, 2021. https://downloads.usda.library.cornell.edu/usda-esmis/files/xg94hp534/mc87qg53q/bc387b55c/grst0121.pdf
United States Department of Agriculture, National Agricultural Statistics Service. Grain Stocks. March 31, 2021. https://downloads.usda.library.cornell.edu/usda-esmis/files/xg94hp534/db78v700p/7p88db273/grst0321.pdf
United States Department of Agriculture, National Agricultural Statistics Service. Prospective Plantings. March 31, 2021. https://downloads.usda.library.cornell.edu/usda-esmis/files/x633f100h/w6634x823/x633fv29f/pspl0321.pdf
United States Department of Agriculture, National Agricultural Statistics Service. Winter Wheat and Canola Seedings. January 12, 2021. https://downloads.usda.library.cornell.edu/usda-esmis/files/z890rt24s/h989rv85g/j3861078g/wtrc0121.pdf
United States Department of Agriculture, World Agricultural Outlook Board. Cotton Outlook. February 19, 2021. https://www.usda.gov/sites/default/files/documents/cotton-outlook.pdf
United States Department of Agriculture, World Agricultural Outlook Board. Grains and Oilseeds Outlook. February 19, 2021. https://www.usda.gov/sites/default/files/documents/grains-oilseeds-outlook.pdf
Disclaimer: We request all readers, electronic media and others follow our citation guidelines when re-posting articles from farmdoc daily. Guidelines are available here. The farmdoc daily website falls under University of Illinois copyright and intellectual property rights. For a detailed statement, please see the University of Illinois Copyright Information and Policies here.


