The January 4 edition of the U.S. Department of Agriculture (USDA) Agricultural Marketing Service's Grain Transportation Report goew over grain trasportation costs in the third quarter of 2023. In this quarter, the transportation costs for shipping corn and soybeans experienced fluctuations, with costs increasing through the U.S. Gulf route and decreasing through the Pacific Northwest route. This article delves into the trends and factors influencing these transportation costs, highlighting the impact of trucking, barge, rail, and ocean transport on corn and soybean shipments. Additionally, we explore the landed costs associated with these transportation expenses and the corresponding changes in farm values. Understanding these dynamics will provide valuable insights into the grain transportation landscape in Q3 2023.
U.S. Gulf costs
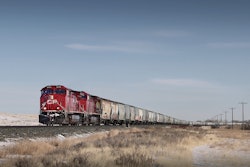
Quarter-to-quarter transportation costs: Transportation costs via the U.S. Gulf route witnessed a significant 22% increase for both corn and soybeans in Q3 2023. This surge was primarily driven by a substantial 104% jump in barge rates, despite low-water restrictions along the Mississippi River System (MRS) constraining barge traffic during this period. However, the slow export sales in Q3 2023 prevented barge rates from reaching the highs observed in the same period of the previous year, when similar restrictions were in place.
Trucking rates for transporting corn and soybeans from Minnesota farms to local grain elevators increased by 4%. On the other hand, ocean rates for both corn and soybeans experienced a slight decline of 2%. These changes in transportation costs reflect the various contributing factors that influenced the grain transportation landscape in Q3 2023.
Year-to-year exports: Comparing Q3 2023 to the same period in the previous year, corn and soybean inspections through the U.S. Gulf declined by 25% and accounted for 65% and 77% of total inspections, respectively. Corn inspections through the Gulf stood at 4.4 million metric tons (mmt), while soybean shipments recorded 3.7 mmt. These figures indicate a substantial decrease in exports, potentially influenced by the changes in transportation costs and other market factors.
Landed costs: Despite the increase in transportation costs, the landed costs for corn via the U.S. Gulf route fell by 4% in Q3 2023. This decrease can be attributed to lower farm values, which offset the transportation expenses. Similarly, the landed costs for soybeans remained relatively stable, as the increased transportation costs were counterbalanced by lower farm values. Transportation costs accounted for 31% of the landed costs for shipping corn and 17% for shipping soybeans. Notably, corn farm values experienced a significant 12% decrease quarter-to-quarter and a 20% decrease year-to-year, while soybean farm values dropped by 4% quarter-to-quarter and 6% year-to-year.
Pacific Northwest costs
Quarter-to-quarter transportation costs: In contrast to the U.S. Gulf route, the transportation costs via the Pacific Northwest (PNW) route witnessed a decline in Q3 2023. Total transportation costs for shipping corn and soybeans fell by 2% and 1% respectively. This decrease can be attributed to lower rail and ocean rates, which contributed to the overall reduction in transportation expenses.
Specifically, rail rates for corn and soybeans dropped by 3% and 2% respectively. These lowered rates played a significant role in the decline of transportation costs for both commodities. The quarter-to-quarter changes in transportation costs indicate the potential cost-saving opportunities available to grain producers and exporters through the PNW route.
Year-to-year transportation costs and exports: When comparing Q3 2023 to the same period in the previous year, the transportation costs via the PNW route experienced a considerable decline. The costs fell by 17% for corn and 16% for soybeans, largely influenced by substantial decreases in truck and ocean rates. Specifically, rail rates for corn and soybeans observed an 8% and 7% decrease respectively. These reductions in transportation costs reflect the changing dynamics of the grain transportation market, making the PNW route an attractive option for exporters.
In terms of exports, there were no corn inspections recorded during Q3 2023 through the PNW route. However, soybean inspections accounted for 2% of the total third-quarter 2023 soybean inspections, with a significant year-to-year decrease of 89%. These figures indicate a shift in the preference for transportation routes and highlight the potential impact on market dynamics.
Landed costs: The landed costs for corn and soybeans via the PNW route experienced a decline in Q3 2023. Corn landed costs decreased by 9%, while soybean landed costs decreased by 3%. These reductions can be attributed to lower transportation costs and lower farm values. As a share of landed costs, transportation costs accounted for 31% for shipping corn and 18% for shipping soybeans. Similar to the U.S. Gulf route, corn farm values decreased by 12% quarter-to-quarter and 20% year-to-year, while soybean farm values dropped by 4% quarter-to-quarter and 6% year-to-year.
WASDE projections
According to the USDA's December 2023 report, the projections for total U.S. corn exports in the marketing year 2023/24 anticipate a 26% increase compared to the previous year, alongside a 10% increase in corn production. Conversely, soybean exports are expected to decrease by 12% in the same period. These projections provide valuable insights into the future trends of grain transportation and the potential implications for transportation costs.