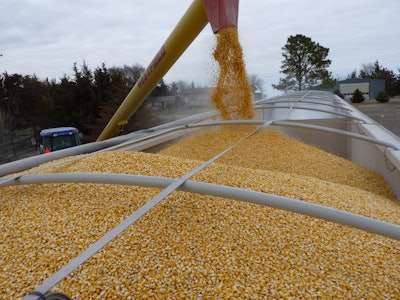
Mike is the general manager of a country elevator operation located in the Corn Belt.
Mike walked into his elevator, shook the snow off his boots, glanced around, and saw the bookkeepers were hard at work. But something was missing — the sounds of phones ringing and farmers talking. Mike looked in at Jeff, the elevator’s grain merchandiser. “How much have we bought since yesterday,” Mike asked.
“Nothing,” said Jeff. “Farmers all say they’re waiting for higher prices, and they seem to be OK for cash flow. This could be a long winter.”
Mike sat down in Jeff’s office and pushed his cap back on his head. “I ran into Dennis uptown yesterday and found out why we missed his bushels this fall. He said our competition offered him some new strategy, told him it was a good deal for him, and he sold them 30,000 bushels of corn. I think I found the info on their website last night. It doesn’t look complicated — it’s just an averaging strategy — seems like an index to me.
“I know farmers aren’t selling much, Jeff, but I think we need to get in front of them a little more. Maybe offering an Index marketing strategy will get some attention for us as well. It gives us more to talk about with customers, and this isn’t some off-the-wall strategy. ”
Producer expectations vs. reality
Producers often say they’re waiting for higher prices to sell their grain. But are their price expectations realistic? For perspective, consider U.S. corn production and the average USDA cash price during October in recent years:
Some farmers may have contracted corn before harvest at higher prices each season, but the October value is their starting reference point for post-harvest marketing plans. Looking back at the gross value of the prior four harvests, it’s understandable that farmers weren’t rushing to sell in the fall of 2015.
Chart 1 shows USDA statistics on the average percentage of the corn crop farmers marketed each month. Looking more closely:
- 29% to 36% during Sept/Oct/Nov since 2010
- about 29% more during Dec/Jan/Feb.
With a crop of 13.7B bushels, and assuming farmers sold a low-end 30% for S/O/N, that amounts to about 4B bushels by the end of November and maybe another 4B to be sold in Dec/Jan/Feb. Corn usage during Sept/Oct/Nov has run 4.2B bushels the past two seasons, and 3.5B for Dec/Jan/Feb. Farm selling didn’t even keep pace with usage during the fall of 2015 and barely did so in 2014.
The end result of the light selling in the fall of 2015 has been that corn basis in November was as much as 10¢ to 30¢ above typical levels in the Eastern Corn Belt, where production fell short. Basis in the Western Corn Belt is closer to typical values, or even a little weaker than in 2012 and 2013 when severe drought cut the WCB crops. Forward basis in the WCB hasn’t shown much if any carry, and carries in the ECB barely cover costs. Elevators sold cash corn basis aggressively into the historically strong values as harvest wound down last fall, which raises the question of why farmers were waiting.
Farmers now have to decide how to market the remaining 70% of their corn. Maybe there are some talking points here for Mike and Jeff to help them with their origination program.
Managing expectations
Farmers hold corn because they want higher prices. Chart 2 shows the average of 15 years of monthly USDA cash prices, with a clear trend of prices rising from October into spring (March/April/May). But averages can be misleading: One or two extreme years can distort the data to where the average represents nothing. Looking at each year individually from fall into spring:
— Cash prices declined in five to six years (varied due to whether a farmer might sell in March compared to April or May.)
- The range was from 1¢ to 52¢ lower.
- The median drop in April was 20¢.
— Cash prices rose in nine to 10 years by an average 61¢.
- The range was 6¢ to $2.00 higher.
- The median gain in April was 61¢.
But what about from January into spring? The price direction of May corn futures from Dec/Jan into March/April/May over the last 15 years shows:
- Five years clearly higher;
- Six years clearly lower;
- Flat or slightly easier in four years:
- The most recent five years were mixed, two higher, one lower, and two showed little net change.
Farmers who hold corn betting on a “seasonal recovery” after harvest may be disappointed a third or more of the time, but there is some justification for farmers’ optimism. The gains in the “up” years are much bigger than the declines in the other years. Any gains (or losses) have to be adjusted for storage and interest costs, however.
The biggest challenge is setting realistic expectations and managing those goals. Futures prices may rise during spring, but when? And the farmer may not pull the trigger if a rally does come.
Mike is right to consider talking to farmers about how an Index pricing strategy works. Mike and Jeff already offer these strategies:
- Sell on a fixed price and go home.
- Sell on an unpriced basis contract if the farmer is bullish futures and wait to price later.
- Sell on a cash Minimum Price Contract and let the option cost replace interest, quality, storage costs.
The attraction of adding an Index or Averaging approach is that the farmer will receive an index value that reflects the composite of the futures prices over a selected pricing period. This can be especially attractive during those nerve-wracking times when markets don’t seem to know whether to go up or down and the farmer isn’t sure when to sell. Another benefit of spreading out the pricings is that the farmer will avoid missing a rally only to end up selling on the low.
The pricing procedures for an Index strategy can be customized or standardized. Mike could set up a program where farmers who participate will sell bushels on a basis contract, and price an equal number of bushels each day during a defined period, or only once a week. The pricings are automatic for the farmers; they don’t even have to call the elevator. For the elevator, Mike and Jeff will hedge the appropriate bushels as pricings occur. The pricing period could cover March/April/May, just April/May, or even go into summer. The only restrictions are the ones Mike sets. They could also give their farmers the flexibility to change their minds down the road and price all remaining bushels at any point by calling the elevator.
- Given the near five-year low in corn futures set in the fall of 2015, using an Index strategy looks reasonably conservative this year. This lets the farmer:
- capture strong basis,
- spread out the pricings over time,
- eliminate holding costs (on-farm or commercially stored), and
- the farmer gets an 80% to 90% advance once the grain is delivered.
Mike and Jeff can also set up a program that allows their customers to forward contract new-crop bushels on an index strategy, and set the futures price on the contract over a predetermined period. They might offer forward index contracts that will price once a week during June, July and August, or only during June and July. An index strategy is easy to document, easy for the farmer to understand and track, and easy for Mike and Jeff to explain. All they have to do is hit the phones!
Hypothetical performance results have certain inherent limitations, and do not represent actual trading. Past results are not indicative of futures outcomes. Trading futures involves risk of loss.


