USDA Shocks Market with US Acreage Update
USDA reported fewer corn and bean acres than what the market expected, though values were on par with FBN’s estimates.
US corn acres came in at 92.7 million, below expectations of 93.8 million but higher than March at 91.1 million and near FBN’s outlook at 92.9 million.
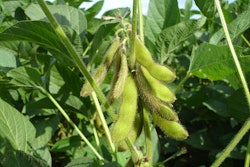
Bean acres were estimated at 87.5 million acres, down 100,000 from March and well below market expectations at 89 million and the low end of the range. But, we were looking for a total of around 86.5 million acres.
Other spring wheat area totaled 11.6 million acres, up slightly from expectations with HRS accounting for 10.8 million acres.
Durum planted area is seen at 1.48 million, essentially unchanged from March and in line with expectations.
Winter wheat area was again revised higher with another 600,000 acres added, bringing the total to 33.7 million.
Cotton acres were pegged at 11.70 million, which was below the average trade estimate of 11.84 million.
FBN’s Take On What It Means: The report shot markets higher on acreage totals for corn and beans coming in well below what the market was expecting. The higher all wheat total by itself is not supportive but the snug corn situation will lend support to Kansas City and Chicago markets. Movements in Minneapolis will be tied to weather for the next month or so but that crop is not being treated well.

Less Stocks on Hand than Expected
USDA reported June 1 grain stocks were lower than expected for corn, soybeans, and wheat.
Corn Stocks were 4,112 million bushels, just slightly below the average estimate of 4,144 million bushels versus 5,003 million last year.
The report implies feed and residual usage was down 15% from last year to approximately 843 million bushels.
Bean stocks were estimated at 767 million bushels compared to the average estimate of 787 million bushels and 1,381 million last year.
June 1 stocks and stocks indicated by actual usage were nearly identical, continuing the recent trend of very small differentials.
Wheat stocks were pegged at 845 million bushels while the trade was expecting 859 million bushels versus 1,028 million last year.
Feed and residual usage of 94 million bushels would be lower than the June USDA forecast of 100 million.
FBN’s Take On What It Means While the grain stocks report did not provide much in terms of surprises, it is still fundamentally supportive for the markets. Reports of extensive wheat feeding have yet to show up in the data as nationwide replacement of corn with wheat in feed rations tends to be more difficult than expected. The confirmation of very tight current stocks without the expanded acres that many were expecting, puts even more pressure on the need for trend yields to prevent stocks from shrinking further. This continues to support FBN’s expectations that risk premiums will remain in the market.
FBN Market Advisory services are offered by FBN BR LLC, dba FBN Brokerage, FBN BR and FBN Market Advisory (NFA ID: 0508695)
The risk of trading futures and options can be substantial and may not be suitable for all investors. Past performance is not necessarily indicative of future results.
This is not an offer or solicitation in any jurisdiction where we are not authorized to do business or where such offer or solicitation would be contrary to the local laws and regulations of that jurisdiction, including, but not limited to, persons residing in Australia and Canada


