On June 1, Transportation Services Division (TSD) of USDA’s Agricultural Marketing Service (AMS) launched an upgraded version– AgTransport 2.0–of its Agricultural Transportation Open Data Platform. The upgrade incorporates new data and stories on various transportation modes and ag-transport-related issues. In particular, as this article describes, new data and an accompanying story have been added to create a digitized and interactive version of the annual publication, Transportation of U.S. Grain: A Modal Share Analysis. With the platform’s flexible and interactive charts, stakeholders can now quickly locate needed data on the modal share analysis related to the transportation of U.S. grains domestically and internationally for multiple years.
The Transportation of U.S. Grains: A Modal Share Analysis page on AgTransport 2.0 shows the modal breakdown of grains produced in the United States and moved to domestic and foreign markets by barge, rail, and truck. Waterborne Commerce Statistics of the U.S. Army Corps of Engineers is used for the analysis to calculate tonnages of barged grain, and the Carload Waybill Sample from the Surface Transportation Board is used to estimate the amount of railed grain. Trucking data are derived from known grain production data, as compared to the estimates of railed and barged volumes of grain.
Figure 1 shows the amounts of U.S. corn, soybeans, and wheat produced from 1978 to 2017. Corn production increased significantly during this time, driven by an increase in food, feed, and ethanol production. Also, from 1978 onward, soybean production steadily increased in response to rising global demand for soybeans and soybean derivatives. In 2017, harvests yielded 14.6 billion bushels of corn, 4.39 billion bushels of soybeans, and 1.74 billion bushels of wheat. U.S. corn, soybean, and wheat production data are updated annually and currently are available for 1978-2017. On the platform, figure 1 can be filtered by commodity type, which adjusts the vertical axis numbers, as needed, to highlight selected commodity trends.
Modal share summaries. Transport modes are categorized according to the final movement going to domestic markets or ports for exports. These modes facilitate a highly competitive global agricultural market, connecting U.S. grain producers with domestic and foreign consumers. Charts on the platform display trends regarding transportation used to move grains grown for the food. feed, and other uses. Updates are available annually for modal share data and currently are available for 1984-2017.
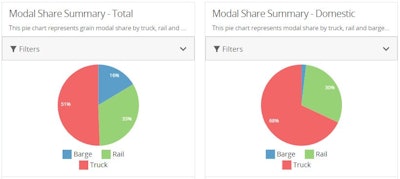
In 2017, for domestic and export markets combined, 63 percent of U.S grains were transported by truck; 23 percent were transported by rail; and 13 percent were transported by barge (fig. 2). Figure 3 shows, for domestic markets, 81 percent of U.S. grains were transported by truck; 18 percent were transported by rail; and 2 percent were transported by barge. For export markets, 46 percent of U.S. grains were transported by barge; 37 percent were transported by rail; and 17 percent were transported by truck (fig. 4). On the platform, the charts in figures 2-4 can be filtered by year and commodity to further analyze trends.
In 2017, total grain movements to domestic markets were 421 million tons, and total grain movements to export markets were 158 million tons (fig. 5). Figure 6 shows U.S. grain shipments for corn, wheat, sorghum, soybeans, barley, and rye. Corn shipments have continued to rise significantly because of increased demand for food, animal feed, and ethanol fuel. Other U.S. grain shipments have slightly increased or remained steady over time, compared to corn. On the platform, the graph displayed here as figure 4 can be filtered by commodity and mode, and the graph displayed here as figure 5 can be filtered by commodity, mode, and market type (i.e., export or domestic).
Finally, figures 7 and 8 show trends over time in shipments of U.S. grains to domestic and export markets. In 1984, U.S. grains to domestic and export markets mostly shipped by rail at 125 million tons. In contrast, by 2017, truck shipments, at 368 million tons, more than doubled the U.S. grain shipped by rail and barge. Figures 6 and 7 can be filtered for further analysis by commodity and market type on the platform.
To access the interactive versions of the charts and graphs included in this article, please visit AgTransport 2.0.