A killing freeze swept the northern plains and western Corn Belt in mid-October, while subsequent wet weather has delayed corn and soybean harvests at record high rates. How many bushels of U.S. grain are still in the field as a result? Find estimates for nationwide losses and exposure below. This is a special report from Atlas, released before the USDA’s November update.
Across the U.S., there is an additional 2.8B bushels of corn and 350M bushels of soybeans still standing in the field compared to the five-year average for this point in the season. Virtually every major corn producing state is affected, but the majority of the corn left in the field is in Iowa, Illinois, Minnesota, and North Dakota.
On a percentage basis, North Dakota shows the most significant lag, with 90% of its corn crop and 44% of its soybean crop unharvested – i.e., more than 50% and 39% above the state’s five-year average, respectively. Luckily, the ten day forecasts for North Dakota shows dry and cold weather is on the horizon, and hopefully farmers will be able to make progress on harvest soon.
“Soils across the state are just too wet to take action,” said Logan Heinrich, an agronomist who has advised growers in North Dakota over the last decade, and worked for Indigo over the past year. “I don’t know if anyone alive has seen this kind of flooding in my area. We’re looking forward to colder days, when the ground can finally firm up and let our guys get out there and harvest.”
Iowa, Illinois, and Minnesota also show significant lags in corn harvest, coming in 29%, 30%, and 31% behind their five-year averages. In Minnesota, the issue is not saturated soil, but snow – a cover that needs to melt before harvest can continue at scale.
“Never seen it this cold at this time of year,” said Scott Schoper, an agronomist working out of the state for the past two decades, and who has been with Indigo since February. “When the temperature is ten degrees or below in the beginning of November, it’s hard on equipment and farmers, and that’s limiting. I have never seen weather as bad in the fall and the spring – it’s usually one, or the other. This year, both were tough.”
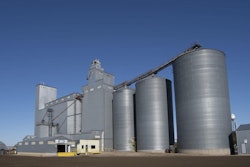
Frozen out. An estimated 300M to 450M bushels of corn were lost as a result of the early, killing freeze this past October. A lot of corn more corn was affected — but not necessarily lost — which is showing up in the high-moisture corn at the elevators. Iowa and Nebraska had the most corn exposed to an early freeze, accounting for 1.2B and 800M bushels of exposed corn, respectively. An interactive map at the bottom of the page offers a view into which counties were most affected.
What’s next? This season’s conclusion mirrors its beginnings: inclement weather, operational delays resulting in a significant portion of the crop being at-risk. The harvest rate is one of the slowest on record; if there is any solace, it is that the rate is far better than the recent 2009 harvest.
The ten day forecast is positive for many of the most heavily affected areas, as a dry spell is on the horizon. The corn will hopefully dry down some in the field, and farmers will be able to get it out before more bad weather sets in. “For the growers I work with, Heinrich said, “I advise: figure out the cost of drying, how you are going to get to the crop in the field, and what the near-term weather is. That’s all the planning you can do. And it can set many of the guys up to be okay.” It’s also possible that growers with access to animal feed markets may be able to sell frost-damaged corn for feed. Corn used for animal feed is only slightly less valuable – somewhere around 2 to 5% – than corn sold on a per-pound basis.
Season-long forecasting analysis holds constant. Indigo is holding its production forecast constant: 12.7B bushels for corn and 3.4B bushels for soybeans. Average yield predictions for both corn and soybeans remain constant at 161.2 bushels per acre (bu/ac) for corn and 45.6 bu/ac for soybeans; these forecasts are below the USDA’s October report, by 7.2 bu/ac for corn and 1.3 bu/ac for soybeans.
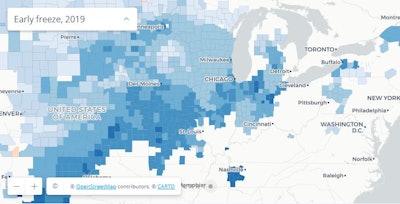
Atlas’ models, powered by the application of machine learning to historical, weather, and remote sensing data, has recognized the risk of an early frost since June of this year. In the beginning of September, Indigo’s geo-innovation and data-innovation teams worked together to build a freeze calculator, which offered early, average, and late freeze dates by county; when the freeze events started occurring in October, Indigo was able to quantify the bushels affected and arrive at the estimated losses referenced above. The map below illustrates the number of days early or late freeze dates were by county relative to 5-year averages.