Do you have a good understanding of how profitable different products or services might be? Do you know how much product must be sold to cover costs or what happens if costs or prices change? These are important considerations in today’s feed and grain business. Understanding break-even points and break-even analysis can be important to making solid business decisions. You want to be sure you can sell enough product or service to make a profit. In this month’s column, we focus on reviewing the details of break-even analysis since this is an important tool for business decisions.
What is break-even?
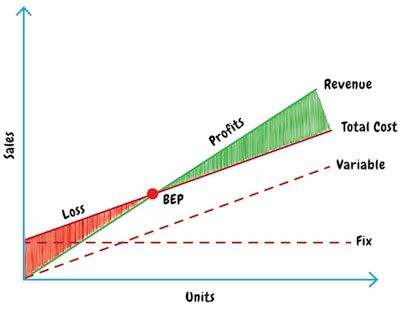
Break-even is the point at which total income from sales equals total expenses. Break-even analysis helps you determine the amount of sales needed to break even. Break-even is used to answer questions such as: what is the minimum level of sales needed to ensure there is not a financial loss and how sensitive is break-even sales volume to changes in costs or price? There are several elements that you need to understand in order to determine your break-even point. These include fixed costs, variable costs, sales revenues, contribution margin and profit goals. Let’s get started looking at these.
Understanding your costs
Categorizing your operating costs between fixed and variable costs is essential for break-even analysis. Fixed costs are those which are not directly related to the volume of production. They are often referred to as “overhead” costs and do not change as sales volume or production changes. You still have these costs — even if production or sales stop. Fixed costs generally include administrative costs and salaried personnel costs, rents, interest, depreciation, insurance and property taxes. Variable costs, on the other hand, are those that change when your production output or sales volume changes. Variable costs generally include wages for labor, raw materials, sellers’ commissions, packaging, freight and energy costs. Classifying your costs is very important to conducting a good break-even analysis, so it is important that you as the manager have a good handle on all of your costs and whether they do or do not change with output or sales. If you have this understanding, then you can properly classify each cost.
Revenues and contribution margin
Revenues are the sales dollars you receive for selling your product or service. You will need to forecast your expected sales by multiplying the number of units of product (for example — tons of dairy feed) or service that you expect to sell by the price you will charge your customers.
Contribution margin is another important element to understand in break-even analysis. Once you know your variable costs and have a forecast for your expected sales, the contribution margin is easy to determine. Contribution margin is just revenues minus variable costs. Why is this important? This margin is used to contribute or help cover fixed costs. Once you cover all your fixed costs, then this contribution margin goes directly to the “bottom line” — as profit.
Calculating break-even
Break-even sales can be determined using the following formula:
Break-even sales ($) = fixed costs/(contribution margin/total sales)
Once you have determined your break-even sales in dollars, you can convert this to number of units sold in order to break-even — simply divide break-even sales dollars by the per unit selling price. If units are sold at differentiated prices, then divide by the average selling price per unit.
An example
Suppose your business portfolio involves selling feed by the truckload. Assume you have determined that your fixed costs for this portion of your business are $1,500,000 and your variable costs are $21,000,000. You expect sales revenues of $23,400,000 for the year. So, the break-even calculation would be: Break-even sales = $1,500,000/2,400,000 /$23,400,000) = $14,625,000. Under these assumptions, the business must sell $14,625,000 of feed by the truckload to cover all costs, and then the remainder of sales generate a profit. If your business sells feed by the 25 ton truck at an average price of $180/ton, then you need to sell 3,250 truck loads of feed to meet break-even sales. Since you expect sales of $23,400,000 and break-even sales are $14,625,000, then sales above break-even are $8,775,000. If you look at the contribution margin as a percentage of sales (i.e, the denominator in the break-even formula — 2,400,000 / $23,400,000 in our example), we see that roughly just over $0.1025 of every dollar of sales goes to cover fixed costs.
Including a profit goal
One thing you might want to do is target a specific level of profit for your feed and grain business. This is your profit goal. You can easily incorporate this goal into your break-even analysis to determine the sales needed to reach your target. The profit goal can be incorporated into the break-even formula as follows:
Break-even sales ($) = (fixed costs + profit goal)/(contribution margin/total sales)
Let’s say that you have a profit objective of $900,000. The calculation then becomes: Break-even sales = ($1,500,000 + $900,000) /(2,400,000/$23,400,000) = $23,400,000. Notice that sales to reach break-even and make a profit of $900,000 are the $23,400,000 of sales that you estimated for the year. Thus, if your sales expectations and fixed and variable cost assumptions are correct, your business will have a profit of $900,000 this year. If you want to make a profit of over $900,000, then you will need to generate more sales than you originally estimated. Also, notice that you could determine the profit in our original example by multiplying sales above break-even by the contribution margin as a percentage of sales ratio, $8,775,000 x (2,400,000/$23,400,000) = $900,000.
Sensitivity analysis
After you have determined a break-even point, you can now evaluate a number of different scenarios using the calculation. This is often referred to as a sensitivity analysis and allows you to ask and evaluate a number of “what if” questions. For example, what if you increase your sales price by 25%, or what if your unit sales decline by 25% (these are just a couple examples). These “what if” questions can be quickly answered if you set up a simple break-even calculator in a spreadsheet; this will perform your calculations very quickly and will allow you to look at a number of different situations. The table below illustrates several different scenarios.
Notice that increasing the sales price and reducing variable costs have the greatest impact on increasing profit, assuming that nothing else changes in either situation.
Your turn now
Using break-even analysis in your feed and grain business can help you understand and examine the profit drivers of your business. It is a very useful tool that can help you understand how much you need to sell to cover your costs and how pricing, cost, and volume changes impact these needed sales. Start by gathering your financial data, classifying your costs, and examining your sales. Try creating a spreadsheet with many formulas and developing realistic changes that you might expect during the next year or two in your business. If done correctly, break-even analysis will help you think through business strategies and generate valuable information for your business decision making.