Last week, President Trump walked back the threat to close the southern U.S. border, a potential development that had caused a significant amount of concern among the agricultural community. Hindsight is 20/20, but we don’t need hindsight to tell us that a shutdown (or slowdown) at the southern border would be disastrous for U.S. ag trade.
In 2018, the United States exported more than $19 billion in agricultural products to Mexico. In this Market Intel, we dig into why a border shutdown or even a limited port closure would have affected producers differently based on commodity, season and location.
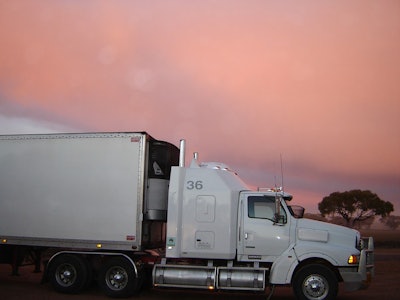
The Department of Transportation (DOT) maintains detailed statistics on U.S.- North American freight by port, commodity group and mode. That data shows 69% of all two-way, U.S.-Mexico trade occurs by truck, 13% by rail, 11% by vessel, 3% by air and 4% by other means, including pipeline and mail.
Agricultural trade follows a somewhat similar pattern; 69% of two-way, U.S.-Mexico agricultural trade occurs by truck, 20% by rail, 9% by vessel and 2% by other means, including air.

On a commodity basis, corn, dried distillers grains and soybeans are the most reliant on rail transportation, while wheat and sorghum are more likely to travel by vessel.
In total, 54% of coarse grains and oilseeds travel by rail, 34% by vessel, 11% by truck and 1% by other means. As a quick reminder, Mexico is the largest export market for U.S. corn, distillers grains and rice.
Mexico is the second-largest export market for wheat and soybean meal.
Beyond coarse grains and oilseeds, the other 87% of agricultural trade between the U.S. and Mexico is significantly more dependent on truck transit, with 78% of shipments occurring by truck, 15% by rail, 5% by vessel and 2% by other means.
The products that ship by truck tend to be value-added, perishable and in some cases, seasonal. Mexico is the largest export market for U.S. dairy, poultry and eggs.
It is the second-largest market for U.S. pork and fresh fruit and the third-largest export market for beef.

Beyond the mode of transportation, DOT data is also illuminating when it comes to commodity trading patterns through specific ports. Four states make up the southern border. In order of the number of border ports they are: Texas, 13; California, six; Arizona, six; and New Mexico, three.
Among these states, Texas is responsible for the largest share of ag trade by far (73% of total bilateral ag trade), followed by California, which handles 13%; Arizona which handles 12%; and New Mexico which is responsible for 1%.
However, when each southern border state is viewed from the lens of agricultural trade as a share of total trade, Arizona rockets to the top of the list. In 2018, 19% of two-way merchandise that crossed through Arizona ports was agricultural, followed by California (9%), Texas (8%) and New Mexico (2%).
Diving into trade flows on a commodity-by-commodity basis things get even more interesting, and we learn how important individual ports are to the flow of different commodities.

For example, 48% of dairy trade between the U.S. and Mexico occurred through Laredo, TX. An additional 39% of dairy trade passed through El Paso, TX.
Combined, that means that 87% of all U.S.-Mexico dairy trade happens through just two of the 28 southern border ports. Meanwhile, a full 72% of trade in meat products passes through one port: Laredo, TX.
Fresh fruits and nuts are largely transported through other ports than dairy and meat. In 2018, 36% of fruits and nuts went through Hidalgo, TX; 18% through Laredo, TX; 17% through Nogales, AZ, and 13% through Otay Mesa, CA.
Unless you have an intimate knowledge of agricultural production and trade in vegetables, you would expect that fresh vegetables and roots would go through the same ports as fresh fruits and nuts, but that’s not necessarily the case.
In fact, 30% of vegetables and nuts entered Mexico through Nogales, 22% through Laredo, 20% through Hidalgo, 11% through Calexico-East, CA; and 10% through Otay Mesa, CA.
Knowing more about the flow of agricultural products through different ports is important as we consider warnings of potential "traffic and commercial delays" along the southern border as a result of the administration's decision last week to ramp up the number of immigration officers processing Central American migrants attempting to enter the U.S. through Mexico.
The ports along the southern border are not necessarily close to one another, so if a port is closed, trucks will not necessarily divert to another port. Further, port facilities are equipped differently; it’s not as easy as simply driving a truck through a set of gates.
A port like El Paso, which handles a large number of live animals has different equipment and personnel than does Laredo, with its refrigeration for boxed meats.
Instead those trucks will sit and wait, adding to transit times and cost, while subtracting from fresh days on market and supplier reliability. These impacts will be felt by exporters and customers on both sides of the border.
Contact: Veronica Nigh, Economist
Phone: (202) 406-3622
Email: [email protected]